
Sustainability
Initiatives Toward Carbon Neutrality
Outline and Goals of Efforts to Reduce CO2 Emissions
The NGK Group has been making steady progress toward achieving the CO2 emissions reduction targets of our Fifth 5-Year Environmental Action Plan following the NGK Group Environmental Vision, by creating and implementing annual plans.
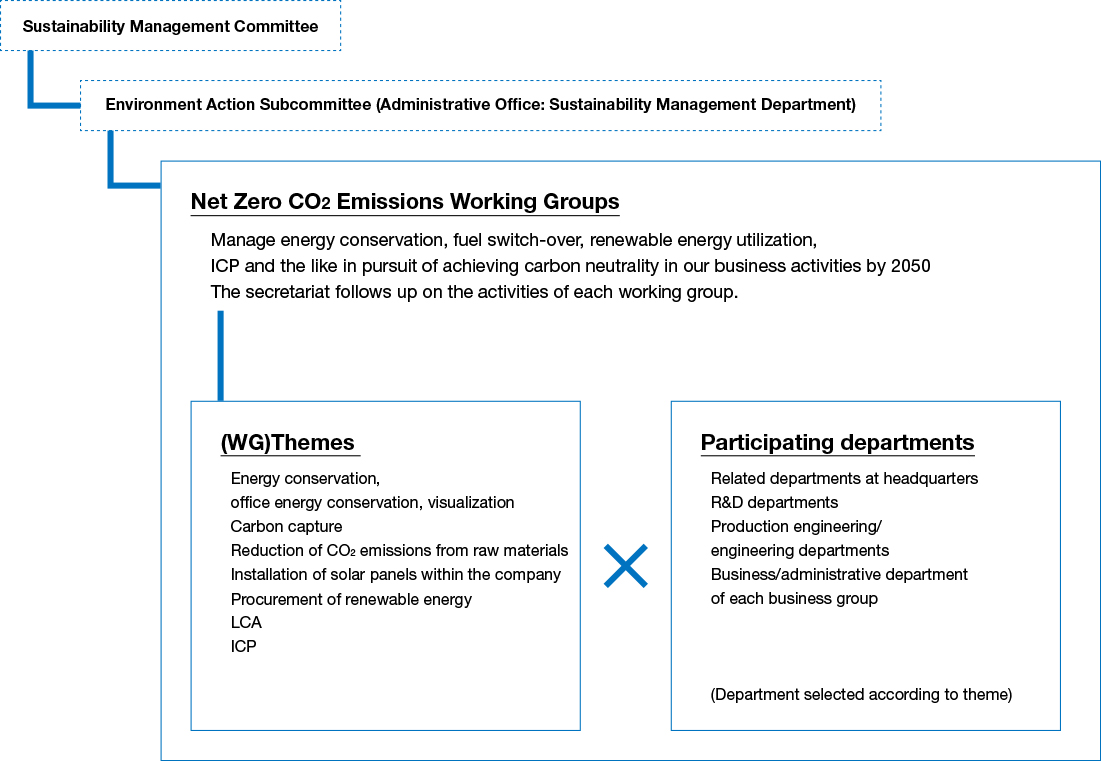
NGK has launched and implemented the Net Zero CO2 Emissions Project as a cross-functional organization in an effort to develop an organization dedicated to carbon neutrality. With the Senior Vice President responsible for manufacturing engineering departments at headquarters serving as the project leader, it has established working groups based on the four strategies for carbon neutrality whose goal is to implement initiatives on various themes, including improving energy conservation efforts, implementing international carbon pricing (ICP), developing fuel conversion technology, and installing photovoltaic power generation systems. In FY2022, we carried out energy conservation patrols and accelerated investments in environment-related equipment through ICP. To visualize energy consumption, we collected monthly energy data and shared this data on an internal platform.
As a result of our energy conservation efforts, CO2 emissions were reduced by 15,000 metric tons. Furthermore, thanks to the installation of photovoltaic power generation systems within the NGK Group, the procurement of renewable energy, and switching to carbon neutral LNG*, we achieved our target of bringing down our CO2 emissions in FY2022 to a total of 560,000 metric tons.
For FY2023, we have set our target CO2 emissions at 560,000 metric tons. This fiscal year, we expect to see an increase in demand in the environment business as passenger car sales recover and exhaust gas regulations are strengthened which could lead to tens of thousands of tons more emissions. Under such conditions, we aim to keep our emissions below FY2022 levels by further promoting energy saving activities and making improvements through process advancements and waste heat utilization, in addition to the initiatives mentioned above. Meanwhile, we have started ceramic firing tests using hydrogen burner furnaces to promote hydrogen use aimed at further encouraging the technical innovation that can help us achieve our net-zero CO2 emissions targets from 2030 onwards. In FY2022, we installed a mass production demonstration furnace to further our efforts to commercialize such furnaces. At the same time, we are also planning to test carbon capture and storage (CCS) for capturing the CO2 we release.
Carbon neutral LNG is a type of LNG considered to have no CO2 emissions because the emissions it releases are offset using CO2 credits.
Net Zero CO2 Emissions Project Promotion Framework
Reduction of CO2 Emissions in Manufacturing Activities
As we strive to reduce CO2 emissions of the Group as a whole, we have focused on developing company-wide organizations, sharing of basic unit targets and CO2 reduction targets, collecting monthly energy data, and visualizing our efforts with the launch of an internal platform, which are steadily showing results. Our main initiatives and their effects are as follows.
CO2 Emissions (all NGK Group production sites)
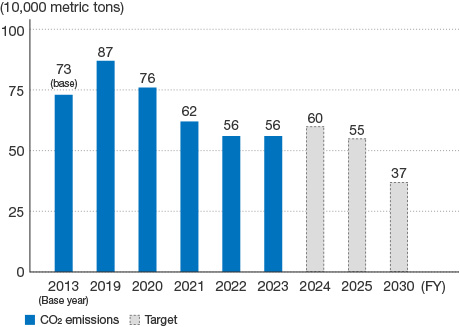
The figures in the graph include the effect attributable to carbon neutral LNG. Carbon neutral LNG is liquid natural gas that has been offset using CO2 credits so that it is not considered to generate CO2 emissions. However, we list it in a separate category since it is not currently eligible for credits under the Act on the Rational Use of Energy.
Main Energy Conservation Activities Aimed at Reducing CO2 Emissions
| Category | Measures | Effects (FY2022) |
|---|---|---|
| Top-down enhancement of energy-saving |
|
CO2 reduction effect Reduction from energy conservation activities: 15,000 metric tons |
| Increase efficiency of manufacturing processes |
|
|
| Energy conservation support for Group companies |
|
|
| Energy conservation activities for general equipment |
|
Energy Conservation of General Equipment and Buildings
The NGK Group has been actively promoting energy conservation activities in relation to general equipment, such as lighting, air conditioners, boilers, and compressors. The headquarters plays a central role in this by sharing know-how among different manufacturing locations, thereby achieving more efficient activities. Whenever our buildings are built or altered, we ensure that large-scale energy-saving measures and ZEB principles are incorporated.
(1) Headquarters engineering supporting energy-saving activities at Group companies
The headquarters provides support for energy conservation measures on general equipment (compressors, boilers, air conditioners, etc.) at overseas production sites. These efforts have produced solid results at overseas Group companies, including NGK Adrec, which manufactures fire refractories, and NGK Ceramic Device, which manufactures electronics parts. Our initiatives include 1) energy conservation patrols (identifying leaks or waste and implementing measures) and 2) visualization of data (establishing appropriate values for energy intensity and conducting management). All of these initiatives are conducted jointly with local members and contribute to the increased energy conservation of manufacturing facilities and dramatic reduction in energy costs.
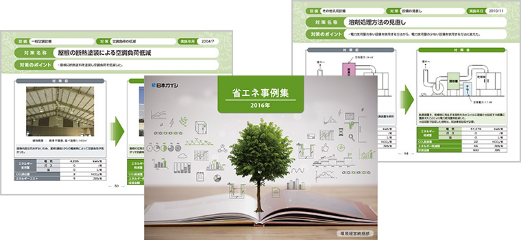
(2) Creating and distributing a printed version of the energy conservation brochure and guidelines
We have created a digital version (Japanese and English) of our energy conservation guidelines and brochure of best practices for distribution within the Group. We also distribute a printed version to each manufacturing site inside and outside of Japan to be kept on hand at worksites for quick reference. This is expected to help enhance voluntary activities and further reduce CO2 emissions.
(3) Efforts to conserve energy of buildings
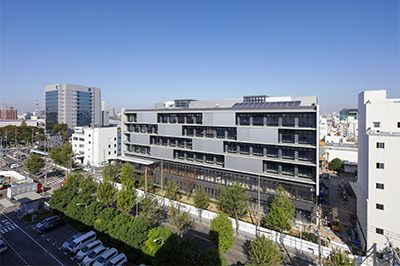
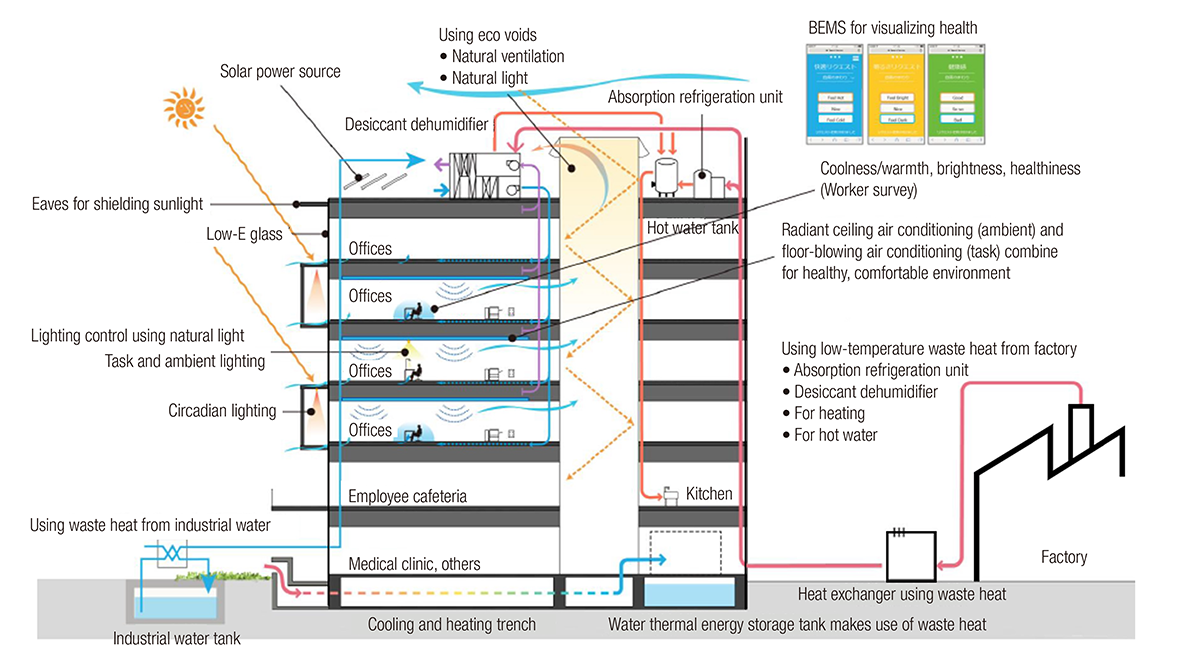
Whenever there is an opportunity to build or renovate a building, we actively endeavor to utilize high-efficiency equipment and introduce renewable energy, and carefully consider each location so as to effectively utilize any natural advantages, such as low-temperature waste heat from our adjacent factories and natural ventilation/lighting, to achieve significant energy savings. Efforts like these allowed the new administration/welfare wing, which was completed in Mizuho, Nagoya in January 2020, to be a zero energy building (ZEB)-oriented office facility whose CO2 emissions are less than half of the official standard. This construction project has been lauded for its pioneering CO2 reduction technology, and it was adopted as a Leading Sustainable Building Project (CO2 Reduction) by Japan’s Ministry of Land, Infrastructure, Transport and Tourism. This allowed us to achieve ZEB readiness in FY2022.
We have many more construction and renovation projects lined up as part of our plans to restructure and update old buildings, all of which will include energy saving and ZEB measures.
 New administration/welfare wing
Adoption of Environmentally Friendly Production Processes
The NGK Group makes efforts to reduce environmental impacts resulting from production through the introduction of highly energy efficient equipment and the promotion of the recovery and use of exhaust heat and improved production efficiency. We are committed to creating even more advanced eco-processes, aimed at enhancing competitiveness.
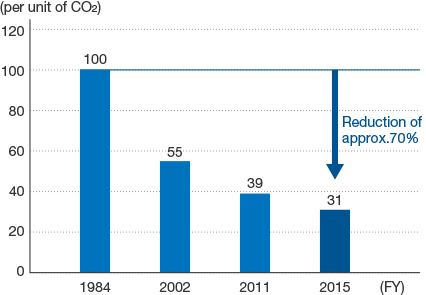
Comparison of CO2 Emissions from Continuous Kilns by Year of Introduction
Change in per unit of CO2 Emissions from continuous kilns, a typical production facility
Activities by Group Companies
Capturing Greenhouse Gas Sulfur Hexafluoride (NGK Stanger, Energy Support, and Hokuriku Energys)
We collect and recycle gas-filled switches that are disposed of by customers. These units contain sulfur hexafluoride (SF6) for insulation purposes. As it has a very high global warming potential, the companies collect all SF6 when disassembling the unit without allowing it to be released into the atmosphere. The total amount of SF6 recovered in FY2022 was 758 kg, which is the equivalent of approximately 17,000 metric tons of CO2.
Process Improvement (NGK Ceramics Polska)
Since 2011, NGK Ceramics Polska has been focusing on improving processes for manufacturing SiC-based diesel particular filters (DPFs), its main product.
Target areas include particularly energy-intensive sintering and drying processes, for which we have carried out various measures to reduce CO2 emissions. To further improve our performance, we will introduce new measures, including technologies provided by the Nagoya Site.

System and Operational Improvements (NGK Metals)
NGK Metals is reducing CO2 emissions by updating control systems and improving the operation of production equipment. Among these, automating the control units of the oil circulation system for rolling mills had a particularly positive effect. The automation eliminated unnecessary around-the-clock operation, a measure taken to address inefficient activation/deactivation processes, as well as simplified complex manual processing. This change helped reduce electric power consumption as well as CO2 emissions.
Introduction of Internal Carbon Pricing
Internal carbon pricing (ICP) refers to the establishment and use of in-house carbon pricing for the purpose of promoting decarbonization-focused investment and policies.
Starting in FY2022, NGK has introduced an ICP of US$130/metric ton-CO2 to incentivize investment in high-efficiency equipment and facilities and renewable energy-related infrastructure that will realize the NGK Group Environmental Vision target of net zero CO2 emissions by 2050. We are also evaluating the possibility of introducing equipment. In FY2023, since the International Energy Agency (IEA) revised the CO2 price used to set the ICP, we revised our ICP to US$140/metric ton-CO2. Going forward, we will pay attention to societal trends and start to consider further application of internal carbon charges.
Introduction of Renewable Energy
We need to expand the use of renewable energy to achieve the goal of net zero in 2050 under the NGK Group Environmental Vision.
Within the NGK Group’s internal Net Zero CO2 Emissions Project, we are systematically promoting installation of photovoltaic power generation systems and procurement of renewable energy while being cognizant of the associated costs.
In FY2021, we procured 100% of electricity from renewable energy sources at all manufacturing sites in Europe (NGK Ceramics Polska, NGK Ceramics Europe, and NGK Berylco France). Specifically, fuel was procured from renewable energy sources at NGK Berylco France, which became the first manufacturing site within the NGK Group to use 100% renewable energy. As for North America, NGK-Locke. has switched over to using 100% renewable energy. In FY2022, we erected mega solar power system installations at NCDK's Tajimi plant, and ACC (NGK Ceramics Suzhou Co., Ltd.)
Meanwhile, in Japan, in addition to the purchase of green certificates to offset emissions, three NGK sites (Nagoya, Chita, Komaki) and NGK Ceramic Device headquarters have switched to LNG, which is completely carbon neutral.
The expanded use of renewable energy is equivalent to a CO2 emissions reduction of 185,000 metric tons compared to the previous year in FY2021, and an additional 10,000 metric tons in FY2022.
Starting in FY2023, we will continue to expand the procurement of renewable energy as well as fully launch the installation of photovoltaic power generation systems. Going forward, we will continue to expand the use of renewable energy.

Membership in RE100
We have joined the RE100 international initiative, which aims to replace 100% of the electricity used in business activities with renewable energy. We aim to get 50% of our electricity from renewable sources by 2025, and have already achieved our goal of 25% by 2022.
Activities toward RE100
We are accelerating initiatives such as procurement of renewable energy and installation of photovoltaic power generation systems within the Group that utilizes large capacity storage batteries called NAS batteries, and Zinc rechargeable battery.
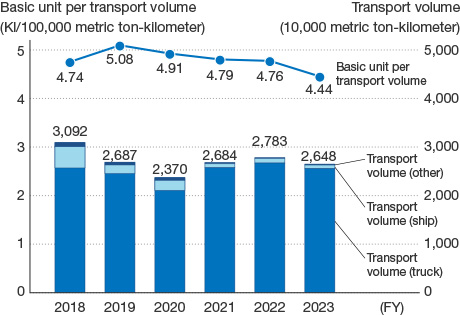
Reduction of CO2 in Logistics Processes
NGK has worked to reduce CO2 emissions from logistics with measures including improving loading efficiency and promoting a modal shift. In recent years, the basic unit per transport volume has been deteriorating due to a decline in the volume of goods transported by sea on account of a change in the product mix. In FY2022, we achieved an improvement in CO2 emissions with a 0.6% reduction year-on-year.

Calculation of CO2 Emissions in Life Cycle Assessment
Life cycle assessment (LCA) is a quantitative evaluation method for environmental impacts of products and services throughout their lifecycle (raw material extraction-raw material production-product manufacturing-distribution/consumption-disposal/recycling). In order to promote carbon neutrality, it is important to not only ascertain our company’s emissions in Scope 1 and Scope 2, but also assess the CO2 emissions within the supply chain and implement reduction initiatives through working collaboratively with suppliers and customers. On top of Scope 3 calculations relevant to the entire company, the first step of our initiatives should be to understand CO2 emissions from the LCA of our own products. Expanding Scope 3 calculation range and conducting life cycle assessment of major products are listed as targets in the NGK Group’s Fifth Five-Year Environmental Action Plan. In FY2021, we performed calculations of two major products (NAS batteries and HONEYCERAM) based on ISO 14040, and in FY2022 we expanded this to NOx sensors and semiconductor manufacturing equipment ceramics. The calculations for these products not only allow us to identify processes with a lot of CO2 emissions, but make it possible to perform quantitative comparisons between products. We are considering expanding such calculations to more existing products and applying them to products under development in the future. We will also confirm the calculated LCA, perform analysis, and work to reduce emissions not only within our own company but throughout our entire value chain.