Beryllium Copper Strip (Strip, Plate, Rod and Wire forms)
Widely used to form contact springs, these products are available as strips, plates, rods, or wire. Choose from a variety of alloy grades and hardnesses for specific applications.

Featured Articles
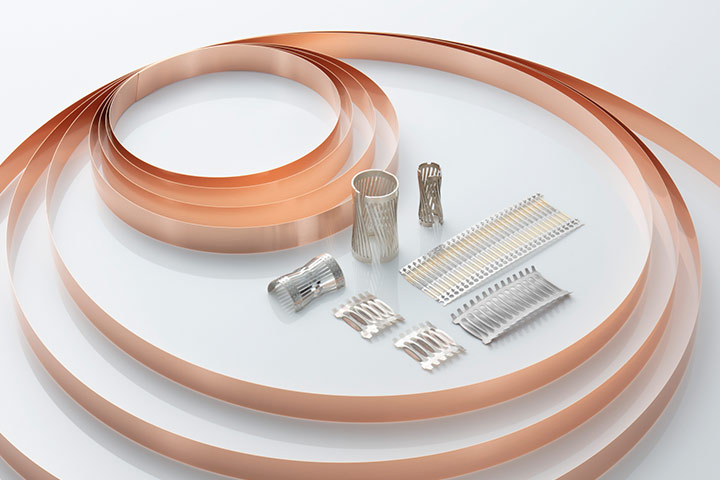
Beryllium Copper is the ideal spring material because of its high mechanical strength and favorable elastic modulus.
The elastic modulus is a common term for the modulus of longitudinal elasticity and is also known as Young's modulus. This value is the slope of the linear portion of the stress-strain curve obtained by a tensile test. Elastic modulus can also be measured directly in the case of a thin flat spring.
Fig. 1 shows the formula for surface stress and spring load in cantilever system. Elastic modulus is one of the important constants for designing contact springs for connectors and switches. In general, if the value is too large, contact force varies greatly with a slight movement of a contact. On the contrary, if it is too small, required contact force cannot be obtained.
Since the ratio of yield strength to Young's modulus of beryllium copper is greater than stainless steel and phosphor bronze, larger displacement and higher contact force can be obtained.
Making full use of beryllium copper spring properties, we can downsize a phosphor bronze spring part while the contact force remains the same. This may also lead to downsizing of plastic parts or terminals around it, thus, we can expect cost saving in total.

Due to the high tensile strength up to 1,500N/mm2, beryllium copper is used to reduce the pitch of contact arrays without deterioration of spring performance. A connector in a given housing space can be designed to a higher density than with any other copper alloy. In conclusion we can reduce the cost per pin compared to phosphor bronze.
Fig. 2 shows an example of downsizing in the design of a battery contact using Beryllium Copper. Due to the reduction of material input and surface area to be plated, total cost compared with phosphor bronze can be lower.
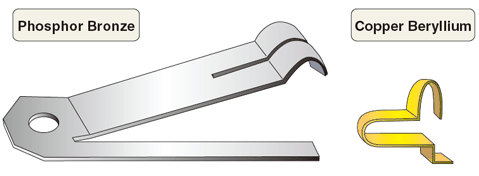
| Material | Phosphor Bronze C5210-EH | Beryllium Copper C1720R-HMB |
|---|---|---|
| Part weight (g) | 1.14 | 0.14 |
| Ratio | 1 | 0.12 |
The temper of age hardenable material ranges from "O", suitable for deep drawing, to "H", cold rolled to obtain high strength with moderate formability. However, as the cold reduction rate increases, material tends to exhibit some anisotropy. It is one of the key factors to choose the highest temper that can be formed in order to optimize the performance and efficiency of a spring part. This also improves dimensional stability during heat treatment.Although mill-hardened material is not fully aged, it did pass through an aging process. Therefore, it is necessary to consider formability when you choose the temper. For critical bending, mill-hardened Type-B or Type-S are suitable.
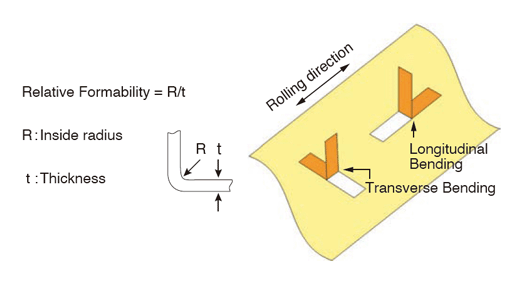
The ratio of the inside bend radius "R" to the thickness "t" is relative formability (See Fig.3). In 90° bending, the test specimen is placed upon the V-block with 90° concave angle and force is applied with a tool so that the specimen will have a right angle bend. The minimum inside radius where no micro crack or intensive orange peel is generated on the outside of the bending point represents "R," and "t" is the material thickness.
Table 1 to 3 show the relative formability of NGK beryllium copper strip. Relative formability slightly changes depending on the thickness, i.e. thinner strip tends to have smaller R/t value. These table show the typical value in thickness 0.15mm.
| Alloy | Type | Temper | R/t | Typical R/t in thickness 0.15mm | ||
|---|---|---|---|---|---|---|
| Long. | Trans. | Long. | Trans. | |||
| 25 | AH | O | 0.0 | 0.0 | 0.0 | 0.0 |
| 1/4H | 1.0 | 2.0 | 0.0 | 0.0 | ||
| 1/2H | 3.0 | 4.5 | 0.0 | 0.0 | ||
| H | - | - | 0.0 | 1.7 | ||
| MH | OM | 0.8 | 2.0 | 0.0 | 0.6 | |
| 1/4HM | 1.0 | 3.0 | 0.3 | 1.0 | ||
| 1/2HM | 2.0 | 4.0 | 0.6 | 2.7 | ||
| HM | 3.0 | 6.0 | 1.0 | 4.0 | ||
| XHM | 4.0 | - | 3.0 | - | ||
| XHMS | 6.0 | - | 4.0 | - | ||
| MH TypeB | OMB | 0.8 | 0.8 | 0.0 | 0.0 | |
| 1/4HMB | 1.0 | 1.0 | 0.0 | 0.0 | ||
| 1/2HMB | 1.3 | 1.3 | 0.0 | 0.0 | ||
| HMB | 2.5 | 2.5 | 0.6 | 0.6 | ||
| XHMB | 3.4 | 3.8 | 1.7 | 1.7 | ||
| XHMSB | 4.1 | 6.0 | 3.5 | 6.0 | ||
| MH TypeS | HM-TypeS | 1.5 | 1.5 | 0.0 | 0.0 | |
| XHM-TypeS | 2.5 | 2.5 | 1.0 | 1.0 | ||
Note: Regard the listed information as design data provided for reference only. The data do not constitute guarantees.
| Alloy | Temper | R/t | Typical R/t in thickness 0.15mm | ||
|---|---|---|---|---|---|
| Long | Trans | Long | Trans | ||
| 8 | HT | 1.0 | 1.0 | 0.0 | 0.0 |
| 11 | HT | 2.0 | 2.0 | 0.0 | 0.0 |
Note: Regard the listed information as design data provided for reference only. The data do not constitute guarantees.
| Alloy | Temper | R/t | Typical R/t in thickness 0.15mm | ||
|---|---|---|---|---|---|
| Long | Trans | Long | Trans | ||
| 7 | 1/2HT | 0.0 | 0.0 | 0.0 | 0.0 |
| HT | 1.5 | 1.5 | 0.0 | 0.0 | |
| EHT | 2.0 | 1.5 | 0.3 | 0.0 | |
Note: Regard the listed information as design data provided for reference only. The data do not constitute guarantees.
Beryllium Copper is widely used in electrical components such as connectors, switches and relays. Spring parts in these components need to keep the contact force reliable over a long period of time. In addition, they are often exposed to the effect of heat. The heat may be due to environmental conditions, or self heating by electric current. Loss of contact force may occur due to stress relaxation.
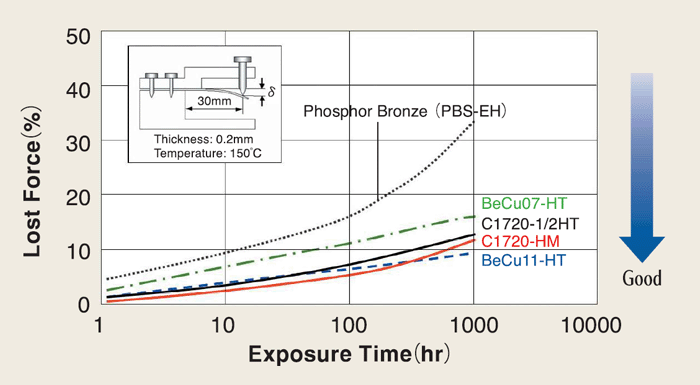
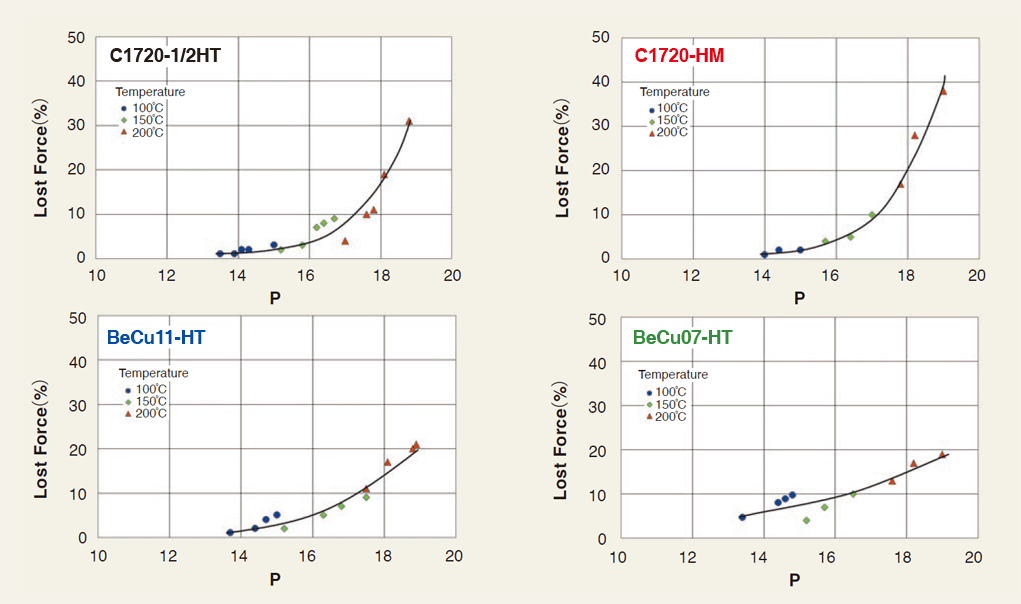
Fig. 4 represents stress relaxation of beryllium copper and phosphor bronze. Stress relaxation is measured on test specimens which are fixed as shown in Fig. 4 and are exposed to the heat under designated conditions of temperatures and periods of time. The permanent set of each test specimen is measured and converted into loss of force value.
Note: Regard the listed information as design data provided for reference only. The data do not constitute guarantees.
Beryllium copper exhibits far less stress relaxation and much better performance in heat resistance than phosphor bronze. Stress relaxation is a kind of creep phenomena. Since it is not practical to monitor the material behavior over a long period of time, we usually estimate the behavior based on the test results for a shorter period of time. Because of the high accuracy the Larson-Miller method is commonly used.
Equation (1) shows the Larson-Miller's experimental formula.

Fig. 5 shows a relationship between remaining stress of Beryllium Copper and Larson-Miller's parameter "P". From this curve, "P" corresponding to given remaining stress is obtained, and we can estimate remaining stress under the combination of temperature and exposure time necessary for the design.
Note: Regard the listed information as design data provided for reference only. The data do not constitute guarantees.
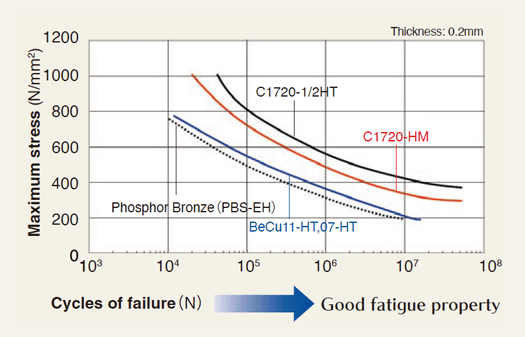
Fatigue strength is important to assure the reliability of contact springs in micro switches or relays for which cyclic motions are required. Fig. 6 shows the fatigue strength of various copper alloys.
Beryllium Copper alloy 25 has higher fatigue strength than any other copper alloy, e.g. 8 times longer durability than phosphor bronze, while alloy 11 and 7 exhibit slightly higher fatigue strength than Phosphor Bronze.
Note: Regard the listed information as design data provided for reference only. The data do not constitute guarantees.
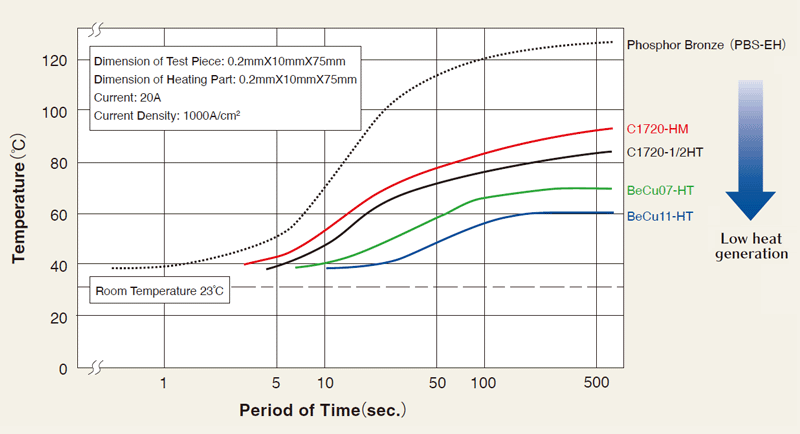
High current (up to 30A) passes through the contact springs in automotive components and relays. Because of its high electrical conductivity, beryllium copper can minimize heat generation caused by resistivity of a contact spring, even if it carries a high current.
Fig. 7 shows the rise in temperature when a current of 20A is passed through test pieces in beryllium copper or phosphor bronze (test piece in 0.2mm x 10mm x 75mm).
After 500 seconds the temperature rises up to 80/90°C in alloy 25, approx. 701 for alloy 7 and approx. 601 for alloy 11, while it reaches more than 120'C in phosphor bronze. Since the internal heat generated by the resistivity of a given material may cause stress relaxation in service, the selection of high conductive material is essential for switches or relays subject to high amperage load.
Note: Regard the listed information as design data provided for reference only. The data do not constitute guarantees.
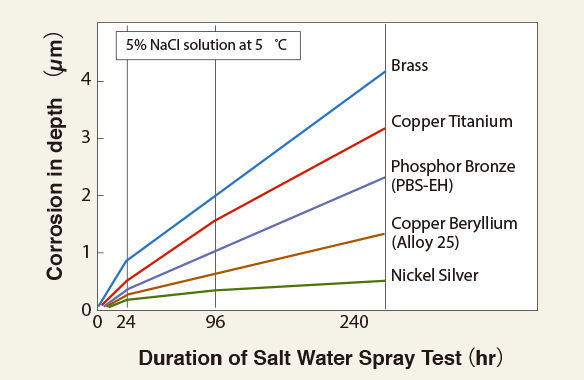
In general, copper and its alloys have good corrosion resistance. Among various copper alloys, beryllium copper has excellent corrosion resistance and a low sensitivity to stress corrosion which can be serious for brass and nickel silver. Also beryllium copper has a better corrosion resistance against seawater than aluminum bronze or copper nickel. Therefore, beryllium copper is an ideal material when corrosion resistance and mechanical strength are required at the same time. A dense oxide film is formed on the surface of beryllium copper by age hardening and acts as protective coating. Thus, beryllium copper also shows good resistance against discoloration at a high temperature.
Fig. 8 shows the magnitude of corrosion by salt water spray in comparison with other copper alloys. Phosphor bronze and copper titanium corrosion will advance at a much more rapid pace.
Note: Regard the listed information as design data provided for reference only. The data do not constitute guarantees.
| Good (0.025mm / year max.) | Limited (0.025-0.25mm / year) | Poor (0.25mm / year min.) |
|---|---|---|
| Ammonia, dry Chloride, dry Sea water (RT) Gasoline Citric acid Acetic acid 0-1%(RT) Bromine, dry Steam Atmosphere, rural, industrial, marine |
Hydrochloric acid, up to 5% Chlorine, moist (RT) Sea water (60°C) Acetic acid 2.5%-10% (RT) Sodium hydroxide up to 10% (RT) Bromine, moist (RT) Sulfur dioxide, moist, up to 10%(RT) Mine water Sulfuric acid, up to 10% (RT) |
Ammonia, moist Ferric chloride Hydrochloric acid over 5% Chlorine, moist (ET) Chromic acid Bromine, moist(ET) Nitric acid Ammonium hydroxide Tin, (molton) |
Our products and industrial standards listed on this page are used for the purpose of convenience to indicate our products and their correspondence with the standards. They do not imply that the materials or our testing methods conform to or comply with the standards.